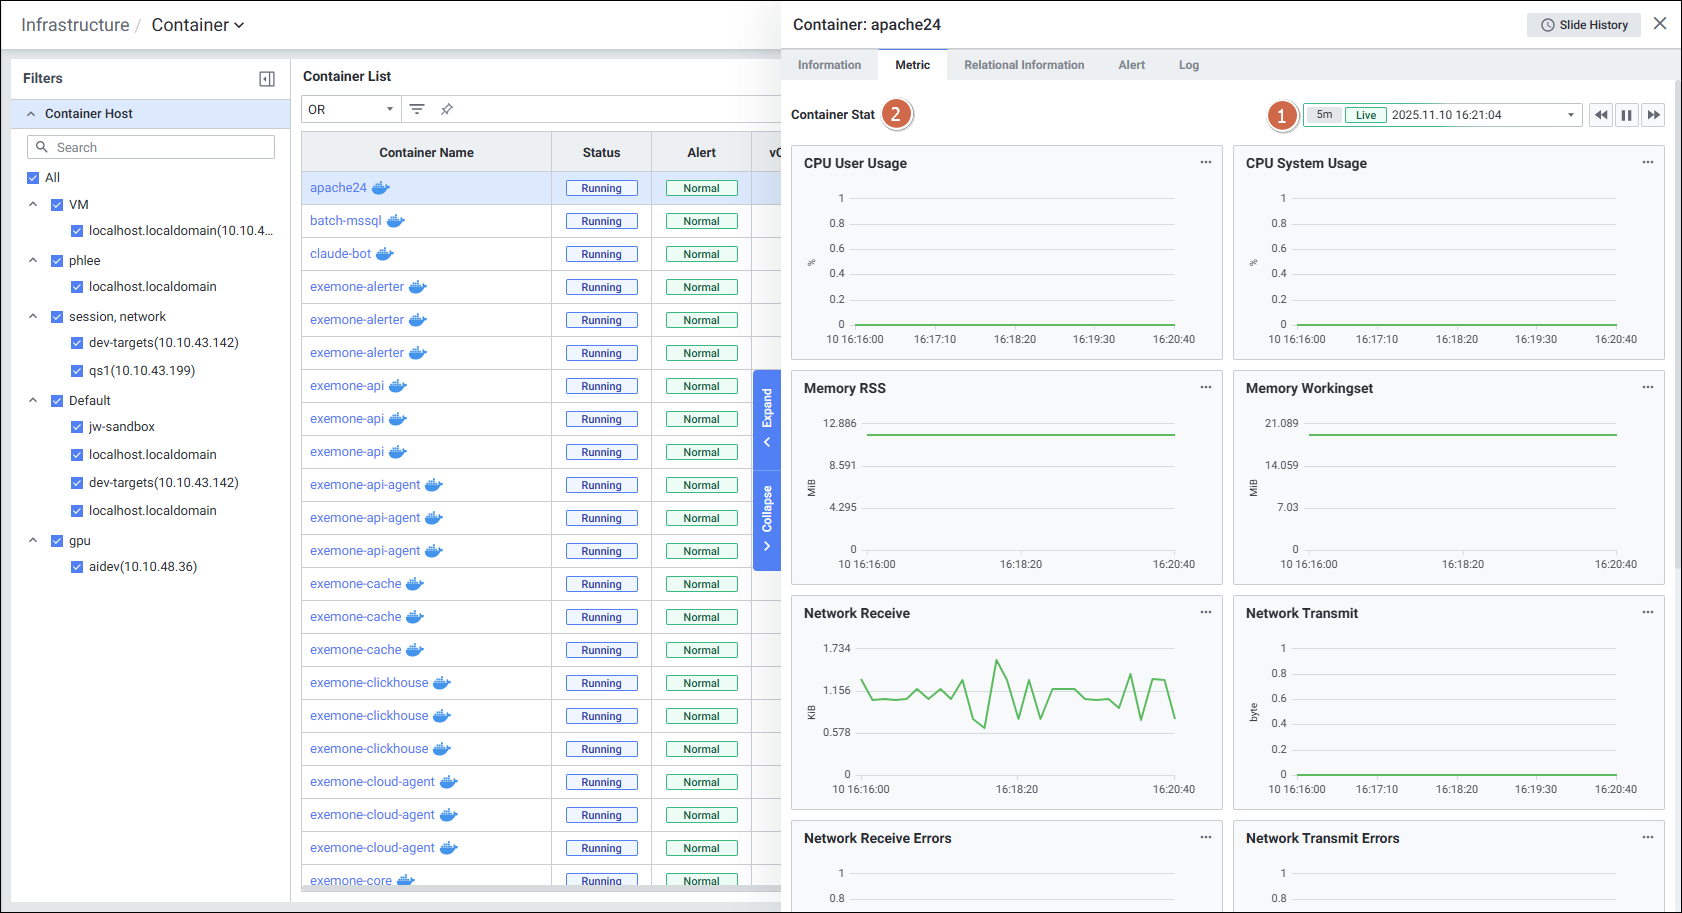
Metric
Container Detail Slide의 Metric 정보를 확인하는 화면입니다.
| 순번 | 항목 | 내용 |
|---|---|---|
| 1 | Global Time | 실시간을 포함한 최근 데이터를 모니터링합니다. Default 최근 5분 데이터를 보여줍니다. Global Time 참고 |
| 2 | Container Stat | 컨테이너 지표를 보여줍니다. CPU User Usage (%) : 컨테이너의 Cpu User 사용량 CPU System Usage (%) : 컨테이너 Cpu System 사용량 Memory RSS (bytes) : 컨테이너의 RSS memory Memory Workingset (bytes) : 컨테이너의 workingset ( usage – inactivefile) Network Receive (bytes) : 네트워크 Receive bytes Network Transmit (bytes) : 네트워크 Transmit bytes Network Receive Errors (count) : 디바이스 드라이버에서 감지한 Receive 에러 패킷 수 Network Transmit Errors (count) : 디바이스 드라이버에서 감지한 Send 에러 패킷 수 Filesystem Read (bytes) : Disk 에서 읽기 한 bytes Filesystem Write (bytes) : Disk 에서 쓰기 한 bytes CPU Throttling Count (count) : Throttling 되는 횟수 CPU Throttling (ms) : Throttling 상태에 머무르는 시간 |